Buffalo Bayou HURRICANE HIKE
Stop 4 // ERODE // Buffalo Bayou System Source
North End of Western Segment of Rosemont Bridge
Figure 4.1. View looking west (upstream) from the Rosemont Bridge on a normal day. The red line marks the Harvey peak water level during the flood phase.
Figure 4.2. View looking west (upstream) from the Rosemont Bridge ~7 days after Harvey, during the middle adjustment phase. The red line marks the peak water level of the flood phase.
View Upstream, Toward Source
Figure 4.1 and 4.2 show the view looking west (upstream) from the Rosemont Bridge seven days post-Harvey and during normal bayou levels. The red line shows the peak water level during the flood phase.
Figure 4.3. Isopach of the Harvey flood sediment layer in Galveston Bay estimated from pre- and post-storm vibra cores, respectively (from Du et al., 2019).
Source
As Hurricane Harvey weakened into a tropical storm late on August 26, it proceeded to stall out southwest of the Houston area, resulting in many areas recording greater than 750 mm (29.5 in) of precipitation, or the 1000-year event return period. The ensuing 11 cubic km (2.64 cubic mi) of runoff caused mobilization of large volumes of sediment. Stearns (2019) investigated the volume of sediment eroded in the source area of the Buffalo Bayou drainage system. These large sediment volumes are thought to have moved from the higher elevation and sloped fluvial systems of west and northwest Houston (Fig. 1.1) downstream towards the tidally influenced regime, then into Galveston Bay. Du et al. (2019) found the effect of freshwater piling in Galveston Bay produced a seaward sloping water surface and a sediment plume, overcoming the dominant longshore current to support a strong outward flow and carry sediment downstream (Figure 4.3). As of spring 2019, an estimated 102,000 cubic m (3.6 million cubic ft) of sediment has been removed along Buffalo Bayou downstream of Addicks and Barker reservoirs (BBP, 2018). In addition, early studies estimate a range of 18-22 years of average annual sediment flux or roughly a 123 million cubic m (4.34 billion cubic ft) flood layer deposit in Galveston Bay averaging 10.5 cm (4.1 in) thick (Du et al., 2019).
Figure 4.4. Gauge height, median daily gauge height, and flood stage of Buffalo Bayou at W. Belt Dr. from August 23 - October 15, 2017 (from USGS, 2017b).
Since the significant floods of the early 20th century, Buffalo Bayou has seen major changes including straightening and deepening of the channel and the construction of Addicks and Barker reservoirs. These were taken as flood control measures to prevent damaging floods to downtown and the densely populated surrounding area. The United States Army Corps of Engineers (USACE) is still working on straightening and deepening the main channel while stabilizing the banks to allow storm water a quicker exit to Galveston Bay and keep water levels lower during excessive rainfall. In addition, by damming Buffalo Bayou ~40 km (25 mi) west of downtown in 1944, the USACE can control water flow into the main part of the city as seen during Hurricane Harvey (Figure 4.4). During Harvey, the reservoirs became nearly filled and controlled releases began on August 30, causing Buffalo Bayou to peak at just over 30,000 cfs and a height of 21.95 m (72 ft) at the USGS Buffalo Bayou at W. Belt Dr. stream gauge (USGS 2017b[jk1] ). These controlled releases continued for 44 days until mid-October when the bayou returned to the median daily flow height. The sediment starved waters from the two reservoirs caused extensive bank erosion immediately downstream of the dams (Fig. 4.5), which led to 1-3 m (3-10 ft) thick sandbar flood deposits downstream (Fig. 0.2 and 3.6) until reaching the tidally influenced estuarine portion of the bayou.
Figure 4.5. South bank of Buffalo Bayou showing a representative view of what the bayou banks look for several miles downstream of the Addicks and Barker dams. Mostly eroded with extensive exposure of roots.
The Flow of Time and Sediments: Seconds, Days, Life Span, Geologic
Figure 4.6. Outcrop of the Pleistocene Beaumont Formation (Horton et al., 2017) on the north Buffalo Bayou bank near the Johnny Steele Dog Park. These are fluvial deposits that were formed on a coastal plain when the coastline was on the order of ~60 miles (~100km) south of where it is today (Paine et al., 2012).
The extensive sediment mobilization from Hurricane Harvey resulted in rapid sedimentation rates that measure in hourly to daily time scales instead of the typical millions of years that geoscientists are familiar with. As discussed in the geologic interpretation of the sand peels at stop 3, we tie the timing of individual layers to the events during the storm. The scour layer (red line in Figures 3.5-7 and 3.11-12 and Plates 1-12) is interpreted to mark the peak flow early on the morning of August 27, 2017. Individual layers (mm- to cm-scale) were deposited in seconds to minutes while sand packages (m-scale) ranged anywhere from hours to days due to the extreme sediment load carried by Buffalo Bayou during Harvey. As described at the Shepherd bridge (stop 1) Harvey scale flood events have happened 4 time in the last 140 years. That is more than twice in an average human lifetime. Compared to the rapid sedimentation during Harvey, in the underlying Beaumont Formation (Fig. 4.6), thousand-year time scales are represented by 1 m (3 ft) of strata (Chowdhury and Turco, 2006). Ongoing detrital zircon age dating by Meyer et al. (2019) at the University of Houston is expected to show that some of the sand grains are millions to billions of years old.
The flow of time and how it is archived is a subject where art and science interrelate in the fluvial tapestries of Buffalo Bayou. As discussed at stop 3, the sand peel sculptures exist in both earth time and human time. The sediment deposited during Hurricane Harvey can be correlated to specific points in earth time using the Shepherd bridge stream gauge, pinpointing a geologic event in human time and geologic time.
As we have seen, the relative time scales represented in Buffalo Bayou are: seconds to minutes for individual layers, hours to days for bundles of layers, years to lifetimes for meters (feet) of sediment, hundreds to thousands of years for the rocks the bayou is cutting into, millions to billions of years for some of the sand grains themselves.
Sediment Routing Research: Andrew Stearns
In spring of 2021 Andrew Stearns completed his masters thesis at the University of Houston on the topic of quantifying sediment transport and analyzing the difference of LiDAR before and after Hurricane Harvey in the whole drainage system. Below is his poster on the topic for the GeoGulf 2019.

Andrew Stearns
GeoGulf Convention
Abstract
Hurricane Harvey made landfall as a Category 4 hurricane in Port Aransas, Texas on August 26, 2017 and produced an extreme precipitation event over Houston, Texas. Harvey stalled out southwest of the Houston area from August 28-30 after weakening to a tropical storm. This resulted in many areas recording greater than 3 feet of precipitation which equaled or exceeded the 1000-year event return period according to the National Hurricane Center. The ensuing 2.6 mi3 of runoff is thought to have caused mobilization of large sediment volumes within fluvial-estuarine systems in the Houston-Galveston region. Thick flood deposits from significant precipitation events decreases the bankfull volume capacity of rivers causing them to be more susceptible to future flooding. We propose a quantitative method to determine the total sediment budget in the Houston-Galveston area during Hurricane Harvey using pre- and post-Harvey high-resolution digital elevation models (DEMs), and sediment dredging reports along major waterways. Elevation difference maps along Buffalo Bayou from before and after the storm show sand bar flood deposits 3-15 feet high within the natural portion of the river from I-610 to Shepherd Drive. In addition, 420,000 ft3 of sediment has been removed along Buffalo Bayou from Shepherd Drive to downtown Houston according to Buffalo Bayou Partnership. For the West San Jacinto river entering Lake Houston, 63,423,000 ft3 of sediment was removed by the US Army Corps of Engineers. The preliminary results indicate sediment mobilization from the uplands to the west-northwest of Houston, and substantial deposition of these sediments corresponding to a break in slope in the stream elevation profile. Similar trends of substantial sediment mobilization are projected for the other fluvial-estuarine systems in the Houston-Galveston region, which could provide implications for future flood control.
Geology: Harvey Sediment Routing
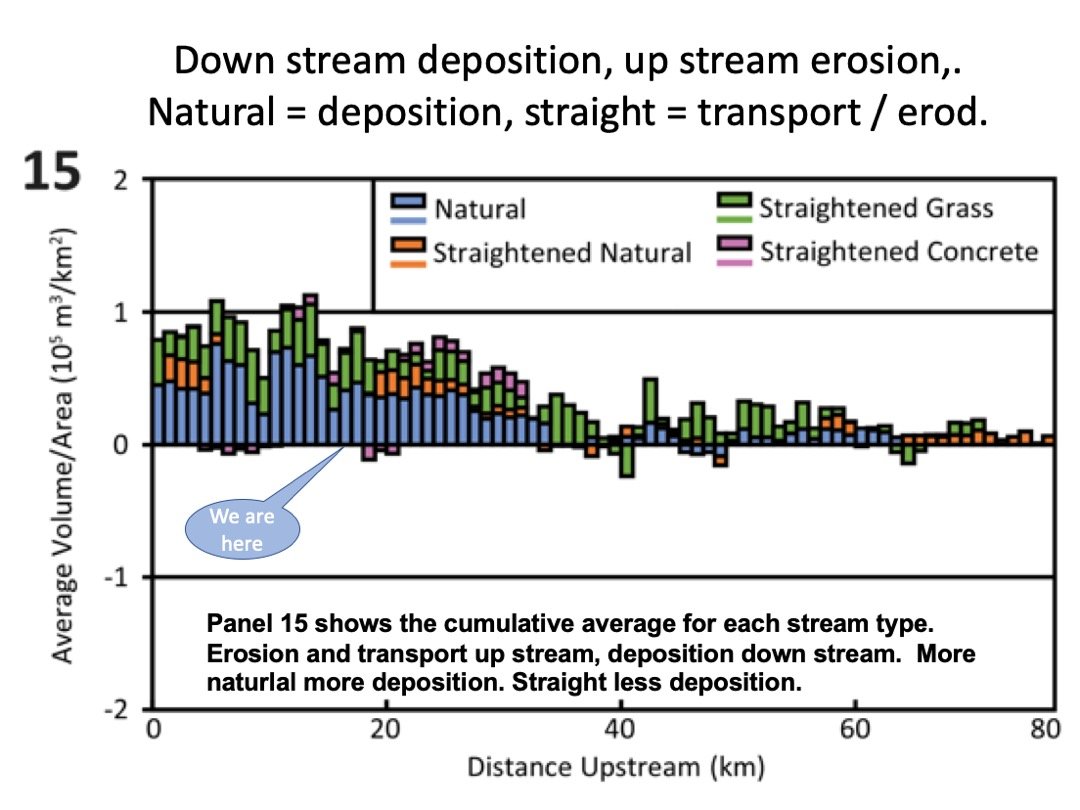
Figure 4.7 A chart of combining all drainages for volume change caused by Hurricane Harvey verse distance up stream with stream type indicated. Note more deposition down stream and in natural stream types (blue and orange).
Research using digital elevation models from LIDAR data before and after Hurricane Harvey demonstrates up stream erosion and bypass and down stream deposition. Also natural stream types are more prone to deposition. “Urban watershed management is more effective when continual updates are implemented based on regional circumstances rather than based on historical fluxes.”
Read the full article here at GeoScienceWorld.org
Acknowledgements
We would like to Dr. Julia Wellner and Jerry Kendall for their contributions with sample collection, processing, and helpful edits. Additionally, USGS and TENRIS for providing the publicly available GIS data files.
References
AECOM, 2012, Stream Technical Report Final 1-27-12, Charting Buffalo: A Collaborative Study of Buffalo and Lower White Oak Bayous. P. 1-390
Anderson, J. B., 2007, the Formation and Future of the Upper Texas Gulf Coast: A Geologist Answers Questions About Sand Storms, and Living by the Sea, p. 1-163.
Blake, E. S. and D. A. Zelinsky, 2018, Hurricane Harvey: National Hurrican Center Tropical Cycle Report, p. 1 - 77. Carlowicz, M. and J. Allen, 2017, Texas Waters Run Brown After Harvey: NASA Earth Obervatory, Land Atmosphere Near Real-Time Capability for EOS.
Du, J., Park, K, Dellapena, T. M., and J. M. Clay, 2018, Dramatic Hydodynamic and Sedimentary Responses in Galveston Bay and Adjacent Inner Shelf to Hurricane Harvey, Science of the Total Environment, v. 653, p. 554 - 564, doi: /10.1016/j.scitotenv.2018.10.403.
Fovenyessy, S. and S. F. Patternson, 2019, Wind or Water? Hurricane Harvey’s Most Destructive Force: Earth Magazine April 2019, p. 28 - 35. Greater Houston Flood Mitigation Consortium, 2018, How do Addicks and Barker Reservoirs Work?: Briefing Document #2, p. 1-4.
Linder, J. and S. Fitzgerald, 2018, Immediate Report - Final Hurricane Harvey - Storm and Flood Information: Harris County Flood Control District, p. 1-32.
Sebastian, A., Lendering, K., Kothuis, B., Brand, N., Jonkman, S.N., van Gelder, P., Godfroij, M., Kolen, B., Comes, T., and Lhermitte, S., 2017, A Fact-Finding Effort in the Direct Aftermath of Hurricane Harvey in the Greater Houston Region: Delft, p. 1-102.
Andrew I. Stearns, Julia S. Wellner, Jerome J. Kendall, Shuhab D. Khan; Sediment routing in an incised valley during Hurricane Harvey (2017) in Houston, Texas, USA: Implications for modern sedimentation. Geology2023; doi: https://doi.org/10.1130/G51312.1
Stearns, A., 2021, Quantifying Hurricane Harvey Sediment Transport in Houston-Galveston Region, University of Houston M.S. Thesis, https://uh-ir.tdl.org/handle/10657/8143
Texas Natural Resources Information System (TENRIS), 2004-2019, Hydrologic, Roadways, Boundaries, and Elevation GIS Datasets.
United States Geologic Survey (USGS), 2019, Stream Gauge Height at Station 08074000 on Buffalo Bayou: National Water Information System.
van Oldenborough, G. J., van der Weil, K., Sebastian, A., Singh, R., Arrighi, J., Otto, F., Haustein, K., Li., S., Vecchi, G., and H. Cullen, 2018, Attribution of Extreme Rainfall from Hurricane Harvey: Environmental Research Letters, v. 13, p. 1-11, doi: 10.1088/1748-9326/aa9ef2.