Buffalo Bayou Hurricane Hike
Stop 5 // DEPOSIT // Buffalo Bayou System: Sink
Middle of Police Memorial Bridge

Figure 5.1. View looking east (downstream) from the Carruth Bridge near the Police Memorial. The red line marks the approximate river level at the peak of the flood phase.
View Downstream Toward the Approaching Shoreline
Figure 5.1 is looking east (downstream) towards downtown Houston. This part of the Buffalo Bayou system is more prone to deposition. During the Pleistocene (2.5-0.0117 ma), fluvial deposits (Beaumont Formation) were formed here on a coastal plain when the coastline was on the order of ~100 km (~60 mi) south of where it is today (Paine et al., 2012). Paine et al. (2012) estimate shoreline retreat rates have been 3-12 m (10-40 ft) per year over the last 16,000 years.
Sink, San Luis Pass
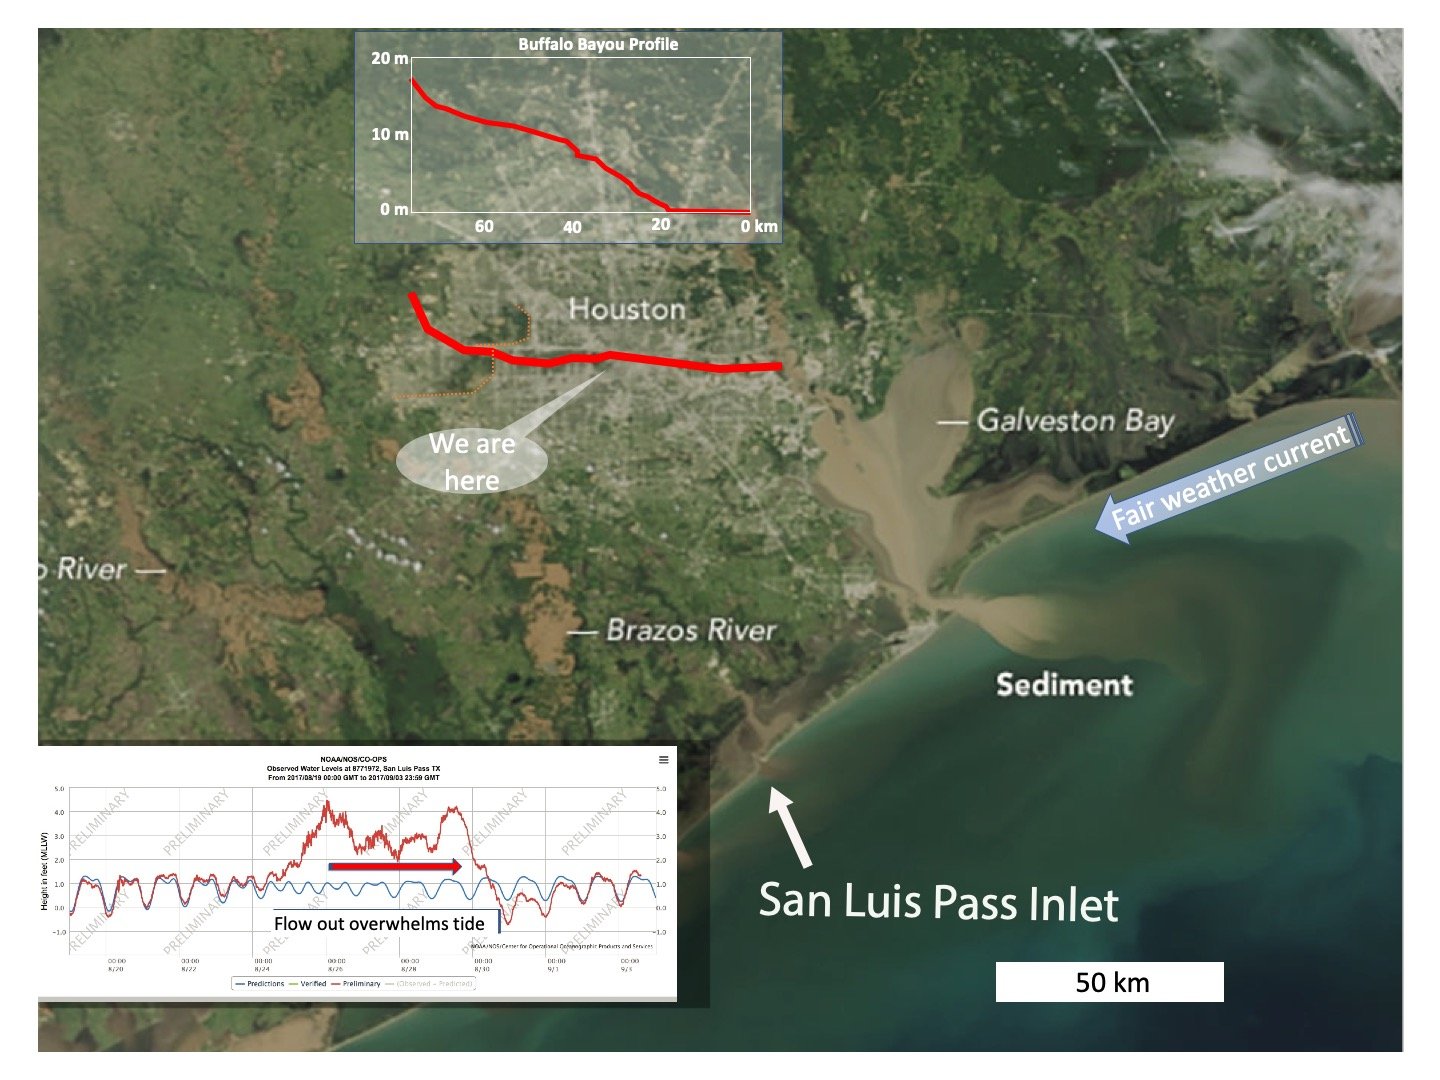
Figure 5.2. Satellite image of the upper Texas coast rivers creating a sediment plume opposite to the dominant longshore current direction (modified from Carlowicz and Allen, 2017).
The Texas coast is in continuous change due to sea level variations, storms, coastal subsidence, and overdevelopment of the coast, with shoreline retreat rates between 1-2 m/yr (3-6.5 ft/yr). The San Luis Pass (SLP) flood tidal delta is the main sink for sediments eroded up-drift in the Texas coast and has an increasing sand flux of 10,000 cubic m/yr (353,000 cubic ft/yr) (Fig. 5.2). These sand deposits are important because they reduce coastal vulnerability to erosion due to storms, such as Harvey, and reduce human risk to rising sea level. The work of Ramon-Duenas and Wellner (2019) at the University of Houston focuses on understanding the sediment transport and the coastal responses to storms in the flood tidal delta. In order to understand the modern sediment dynamics, 155 seafloor sediment samples were collected and analyzed for grain size and lithology; measured water depths were corrected to a datum of mean sea level. This study compares the sediment grain size distribution of samples taken at the same locations both pre- and post-Hurricane Harvey. Post-Harvey sediments have a finer grain size distribution, possibly related to the increased rain runoff during the storm, which carried finer sediments into the bay. Pre- and post-Harvey deposits have a similar lithology, with more than 95% quartz and less than 5% heavy minerals. The grain-size changes give us a hint of how the flood tidal delta responds to storm episodes in a more erosive way than other areas in the Texas coast.

Figure 5.3. Sketch of the evolution and migration of San Luis Pass (Wallace and Anderson, 2013).
GeoGulf 2019 Field Guide Collaborator: Carolina Ramon-Duenas
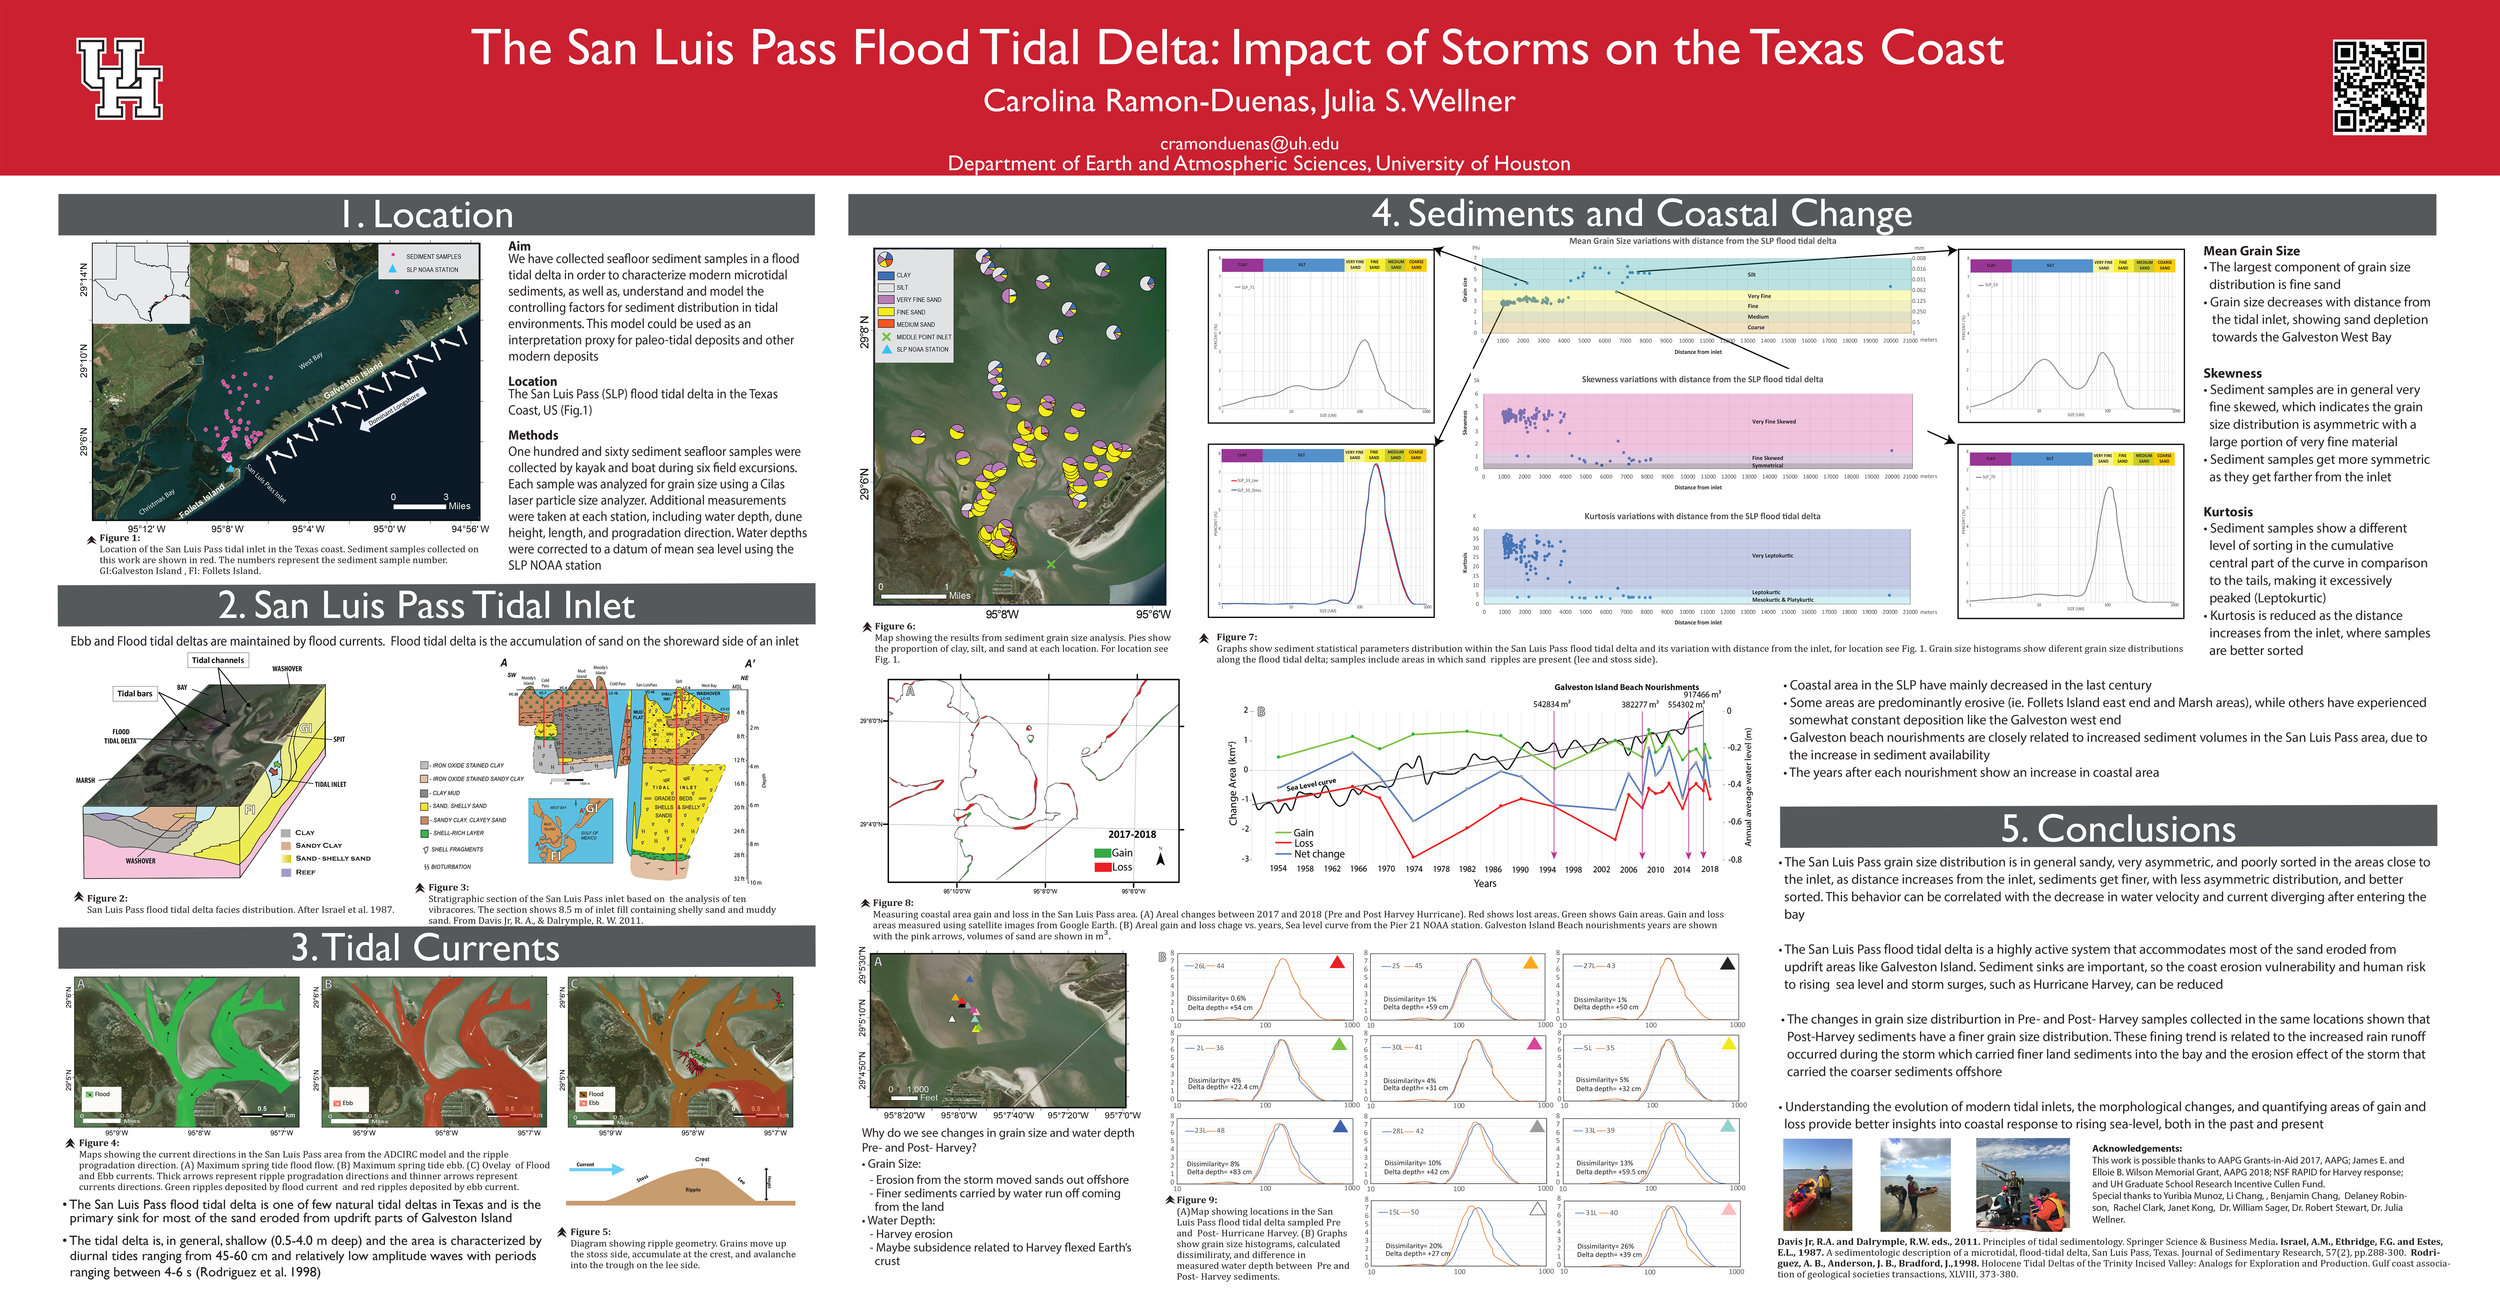
As a PhD student Carolina studied the impact of Hurricane Harvey at the San Luis Pass among other things. She published a poster on the topic at GeoGulf Convention 2019.
Carolina Ramon-Buenas
GeoGulf Convention
