Hurricane Harvey // Sand Peel Sculpture 1

Plate 1A. Sand Peel Sculpture 1
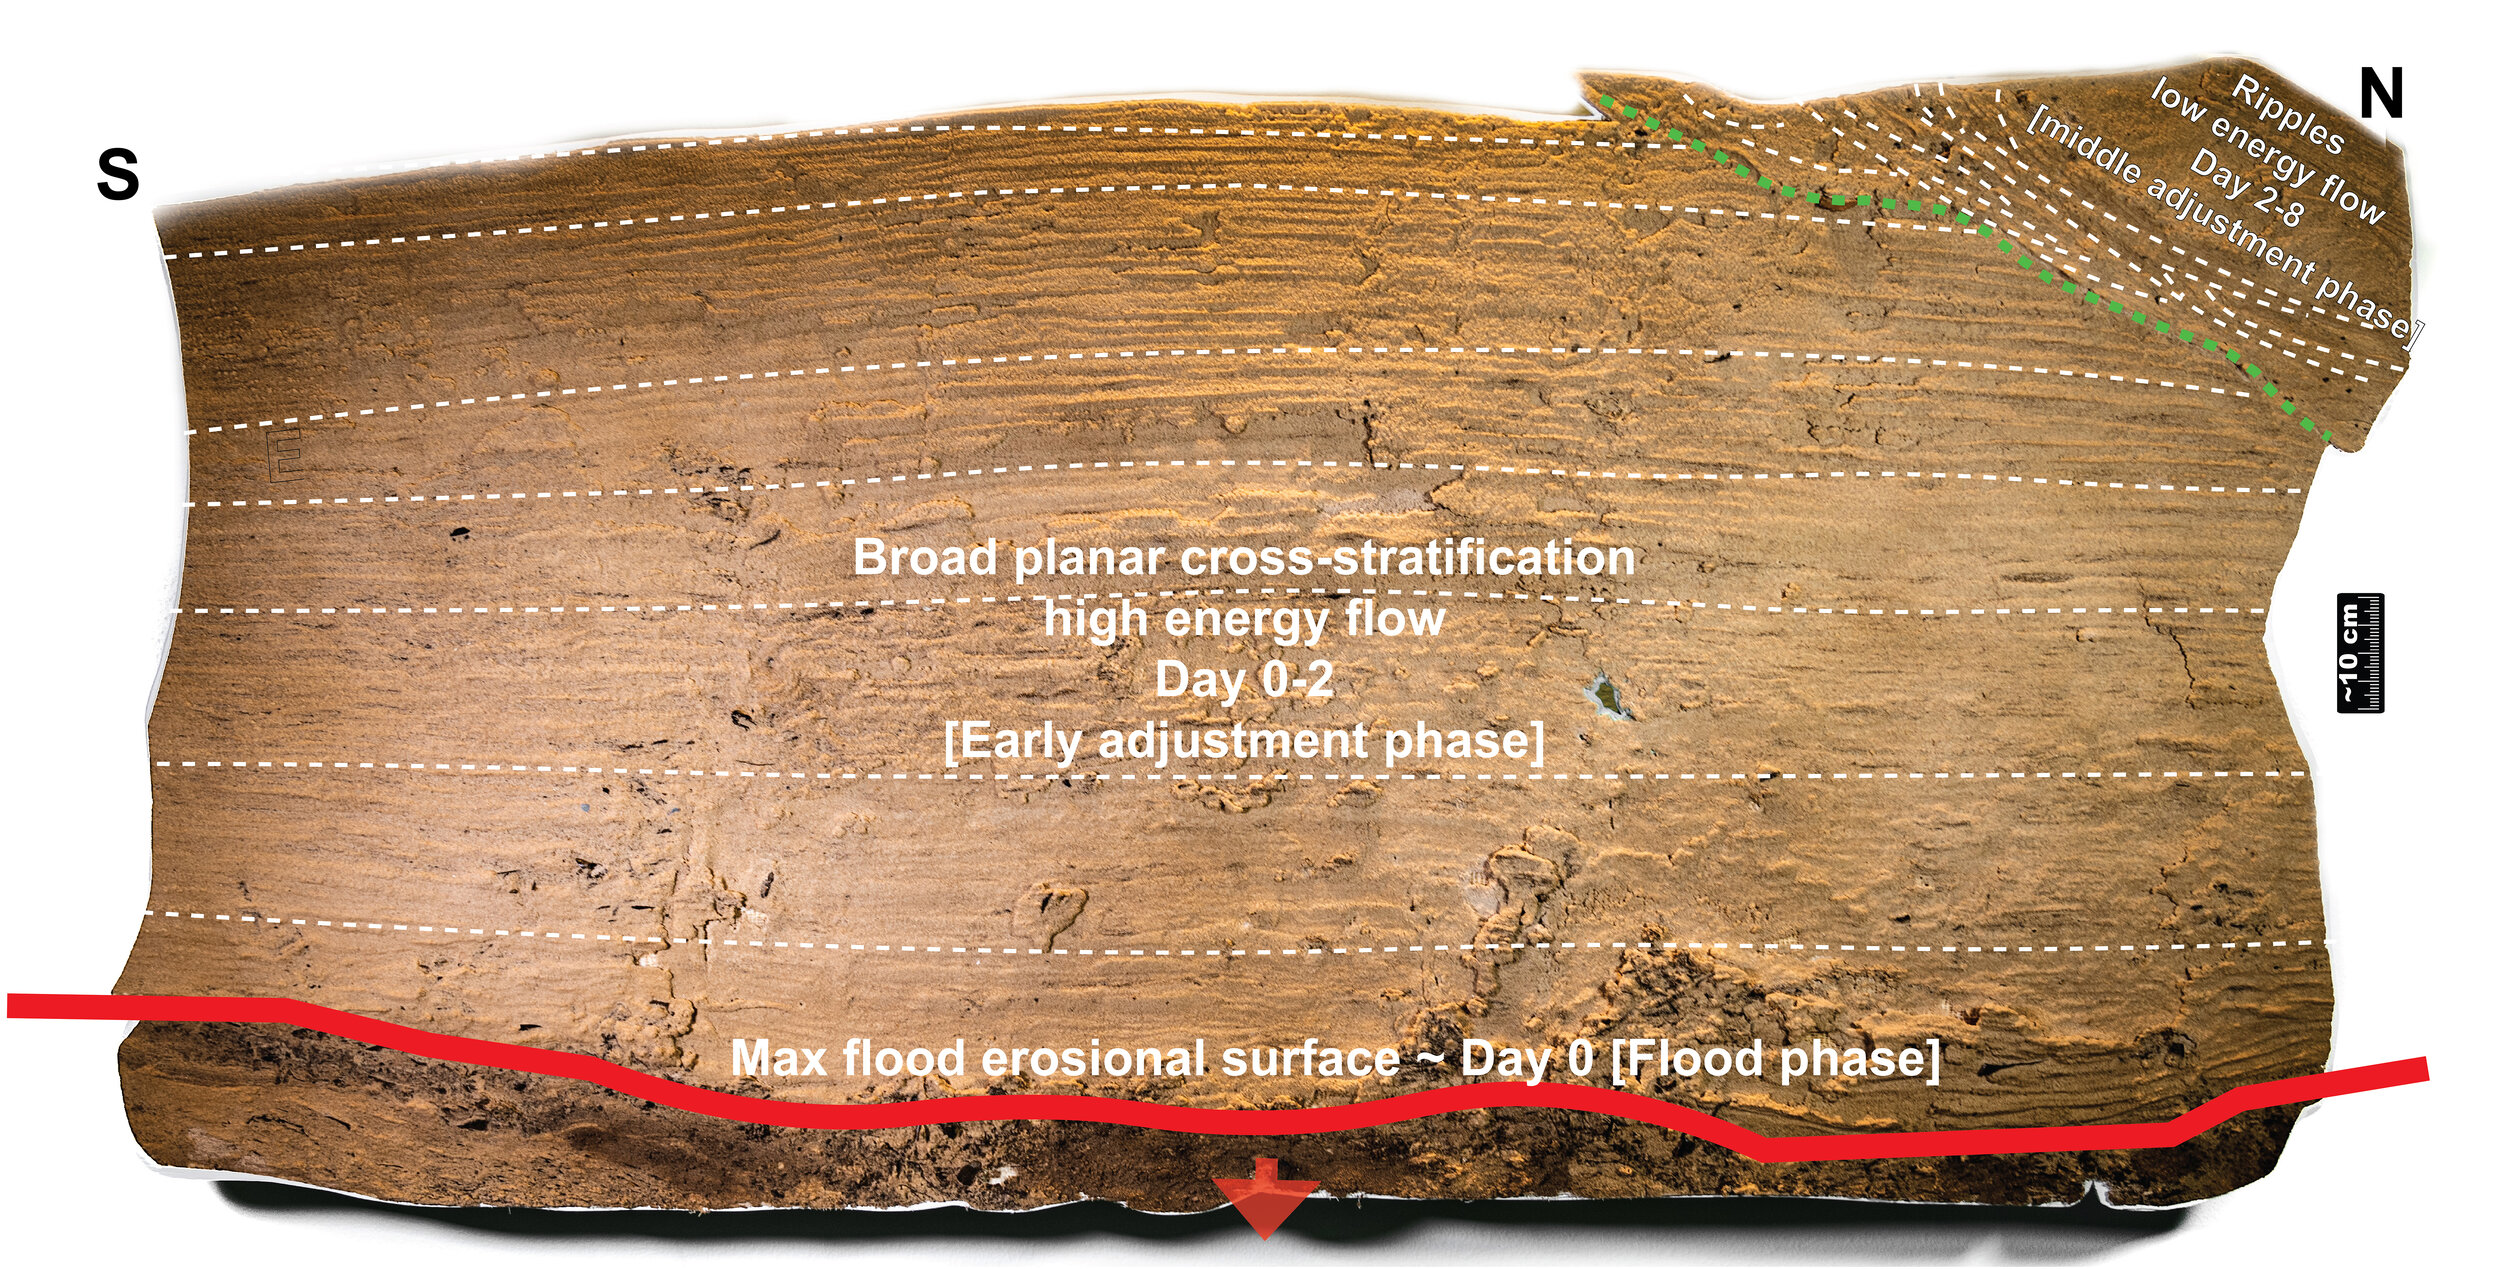
Plate 1B. Sand Peel Sculpture 1 Interpretation
Context, Description, and Interpretation:
Peel 1 records the initial erosion during the maximum flooding followed by rapid deposition of sands as the energy levels quickly dropped. The hydrologic archive shows the rapid rise and fall of Buffalo Bayou. During this time frame, the 211 calls were dominated by immediate needs for food and shelter in Houston.
Summary: This peel shows low energy pre-Harvey deposits at the base, overlain by an erosional surface (red line) marking the base of a high energy environment with upper flow regime bedforms. At the top north corner there is another erosional surface (dashed green line) that marks a change into a lower flow regime evident by formation of ripples.
The base of Peel 1 is a mud layer rich in organics, deposited under very low energy conditions prior to the Harvey event. At the top of the mud layer is an erosional surface (red line) marking the onset of Harvey deposits. Immediately above the erosional surface there is a transition to planar cross stratification indicating upper flow regime, which marks a rapid influx of sediment moving at high velocity. Most of the peel above this surface exhibits consistent planar cross stratification, with some soft sediment deformation indicating a rapid influx of saturated sediment. In the upper north corner of the peel there is another erosional surface (dashed green line) where a trough cuts across the planar strata. Within this trough, there are small ripples indicating lower flow regime. The red arrows indicate the easterly flow direction.
Event Timing
Flood phase
August 28, 2017: The red line marks the erosional surface above the low energy pre-Harvey deposit. This erosion occurred during the flood phase as Buffalo Bayou rose to its peak at about 1:00am on August 28, with a measured gauge height of 15 m (41.9 ft). Flow was to the east.
Early adjustment phase
August 28-30, 2017: The water level dropped rapidly to 7.7m (25.3 ft) by August 30. As the flood waters dropped, the flow conditions were in the upper flow regime and sediment was accumulated as bar deposits. On Peel 1, the sediment deposited during this time appears from the red line to the dashed green line. Flow was to the east.
Middle adjustment phase
August 30-September 5, 2017: The water level continued to drop at a more gradual rate. During this period of time, the flow conditions were in the lower flow regime. On Peel 1, these deposits appear as ripples above the green line. Flow was to the east.