Hurricane Harvey // Sand Peel Sculpture A

Plate 2A. Sand Peel Sculpture A
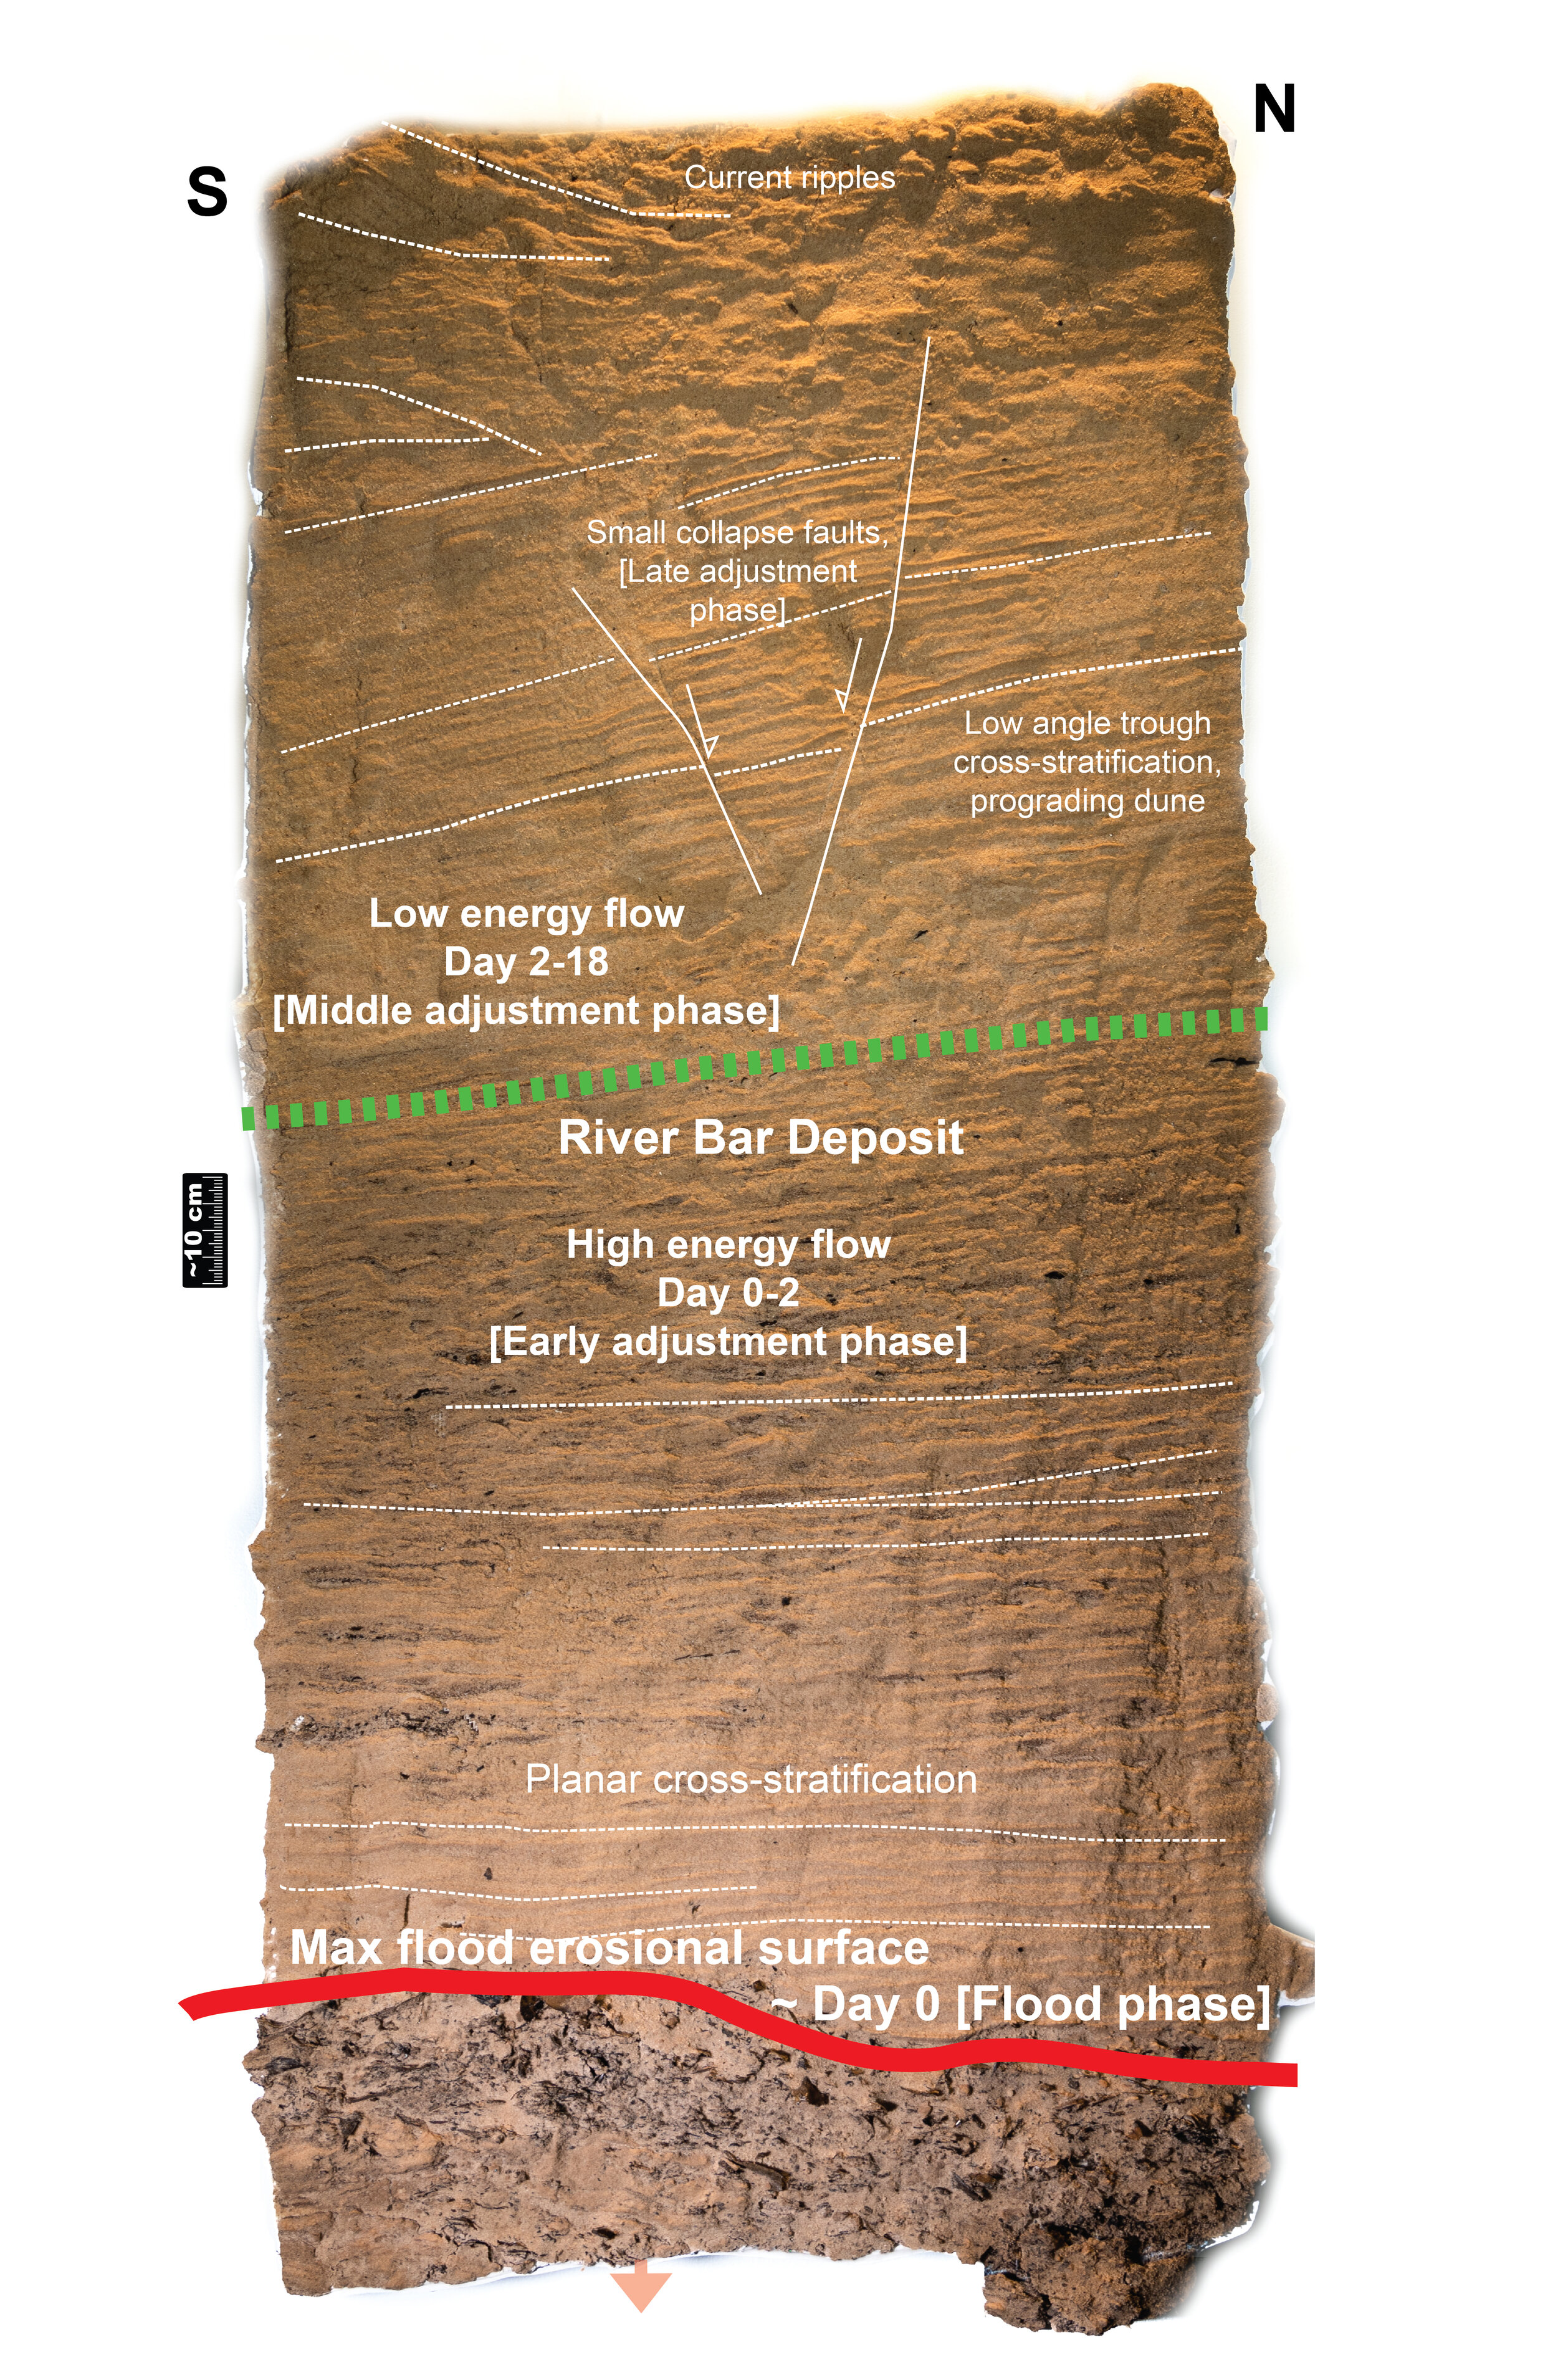
Plate 2B. Sand Peel Sculpture A Interpretation
Context, Description, and Interpretation:
Peel A records the initial erosion during the maximum flooding phase followed by rapid deposition of sands as the energy levels quickly dropped. Small faults record late adjustment of the deposits as the bayou returned to its channel. The hydrologic archive shows the water level’s rapid rise and fall and the return to channel ~ 30 days post maximum flooding. After this time, the human impact recorded by 211 calls showed a change from food and shelter needs to financial needs.
Summary: Peel A records a flood, the progressive growth of a sand bar, and the cutting of that sand bar by a late cross flow.
The base of Peel A exhibits a pre-Harvey layer of organic-rich medium to fine sand truncated by an erosional surface. Above the erosional surface, planar cross stratification indicates upper flow regime. Alternation of fine to very fine sand layers within the planar cross strata indicates varying flow strength throughout deposition. The dashed green line indicates a transition from planar cross stratification to low angle trough cross stratification due to the formation of a prograding dune. This indicates a decrease in the energy conditions from upper to lower flow regime. At the top of the peel, there is a greater decrease in energy and flow velocity evident by a transition into small troughs formed by current ripples. Within the dune there are two small collapse faults (white lines) which formed after deposition, likely caused by a nearby slump (gravitational failure) into the cross-cut channel. These would have occurred after October 1, when the gauge height was below 3 m (10 ft). The red arrows indicate the easterly flow direction.
Event Timing
Flood phase
August 28, 2017: Buffalo Bayou reached its peak flood phase at about 1:00am, with a measured gauge height of 15 m (41.9 ft). On Peel A, this date and time is marked by the erosional surface (red line). Flow was to the east.
Early adjustment phase
August 28-30, 2017: The water level dropped rapidly to 7.7m (25.3 ft) by August 30. As the flood waters dropped, the flow conditions were in the upper flow regime and sediment was accumulated as bar deposits. On Peel A, the sediment deposited during this time is from the red line to the dashed green line. Flow was to the east.
Middle adjustment phase
August 30-September 16, 2017: The water level dropped more gradually from 7.7 m (25.3 ft) on August 30 to 3.1 m (10.3 ft) on September 16. Flow conditions were in the lower flow regime and bar deposits continued to accumulate, seen above the dashed green line on Peel A. Flow was to the east.
Late adjustment phase
October 1-November 29, 2017: Slumping into the cross-cut channel east of and parallel to Peel A causes small faults in the middle adjustment phase sand bar.