Hurricane Harvey // Sand Peel Sculpture 3

Plate 8A. Sand Peel Sculpture 3
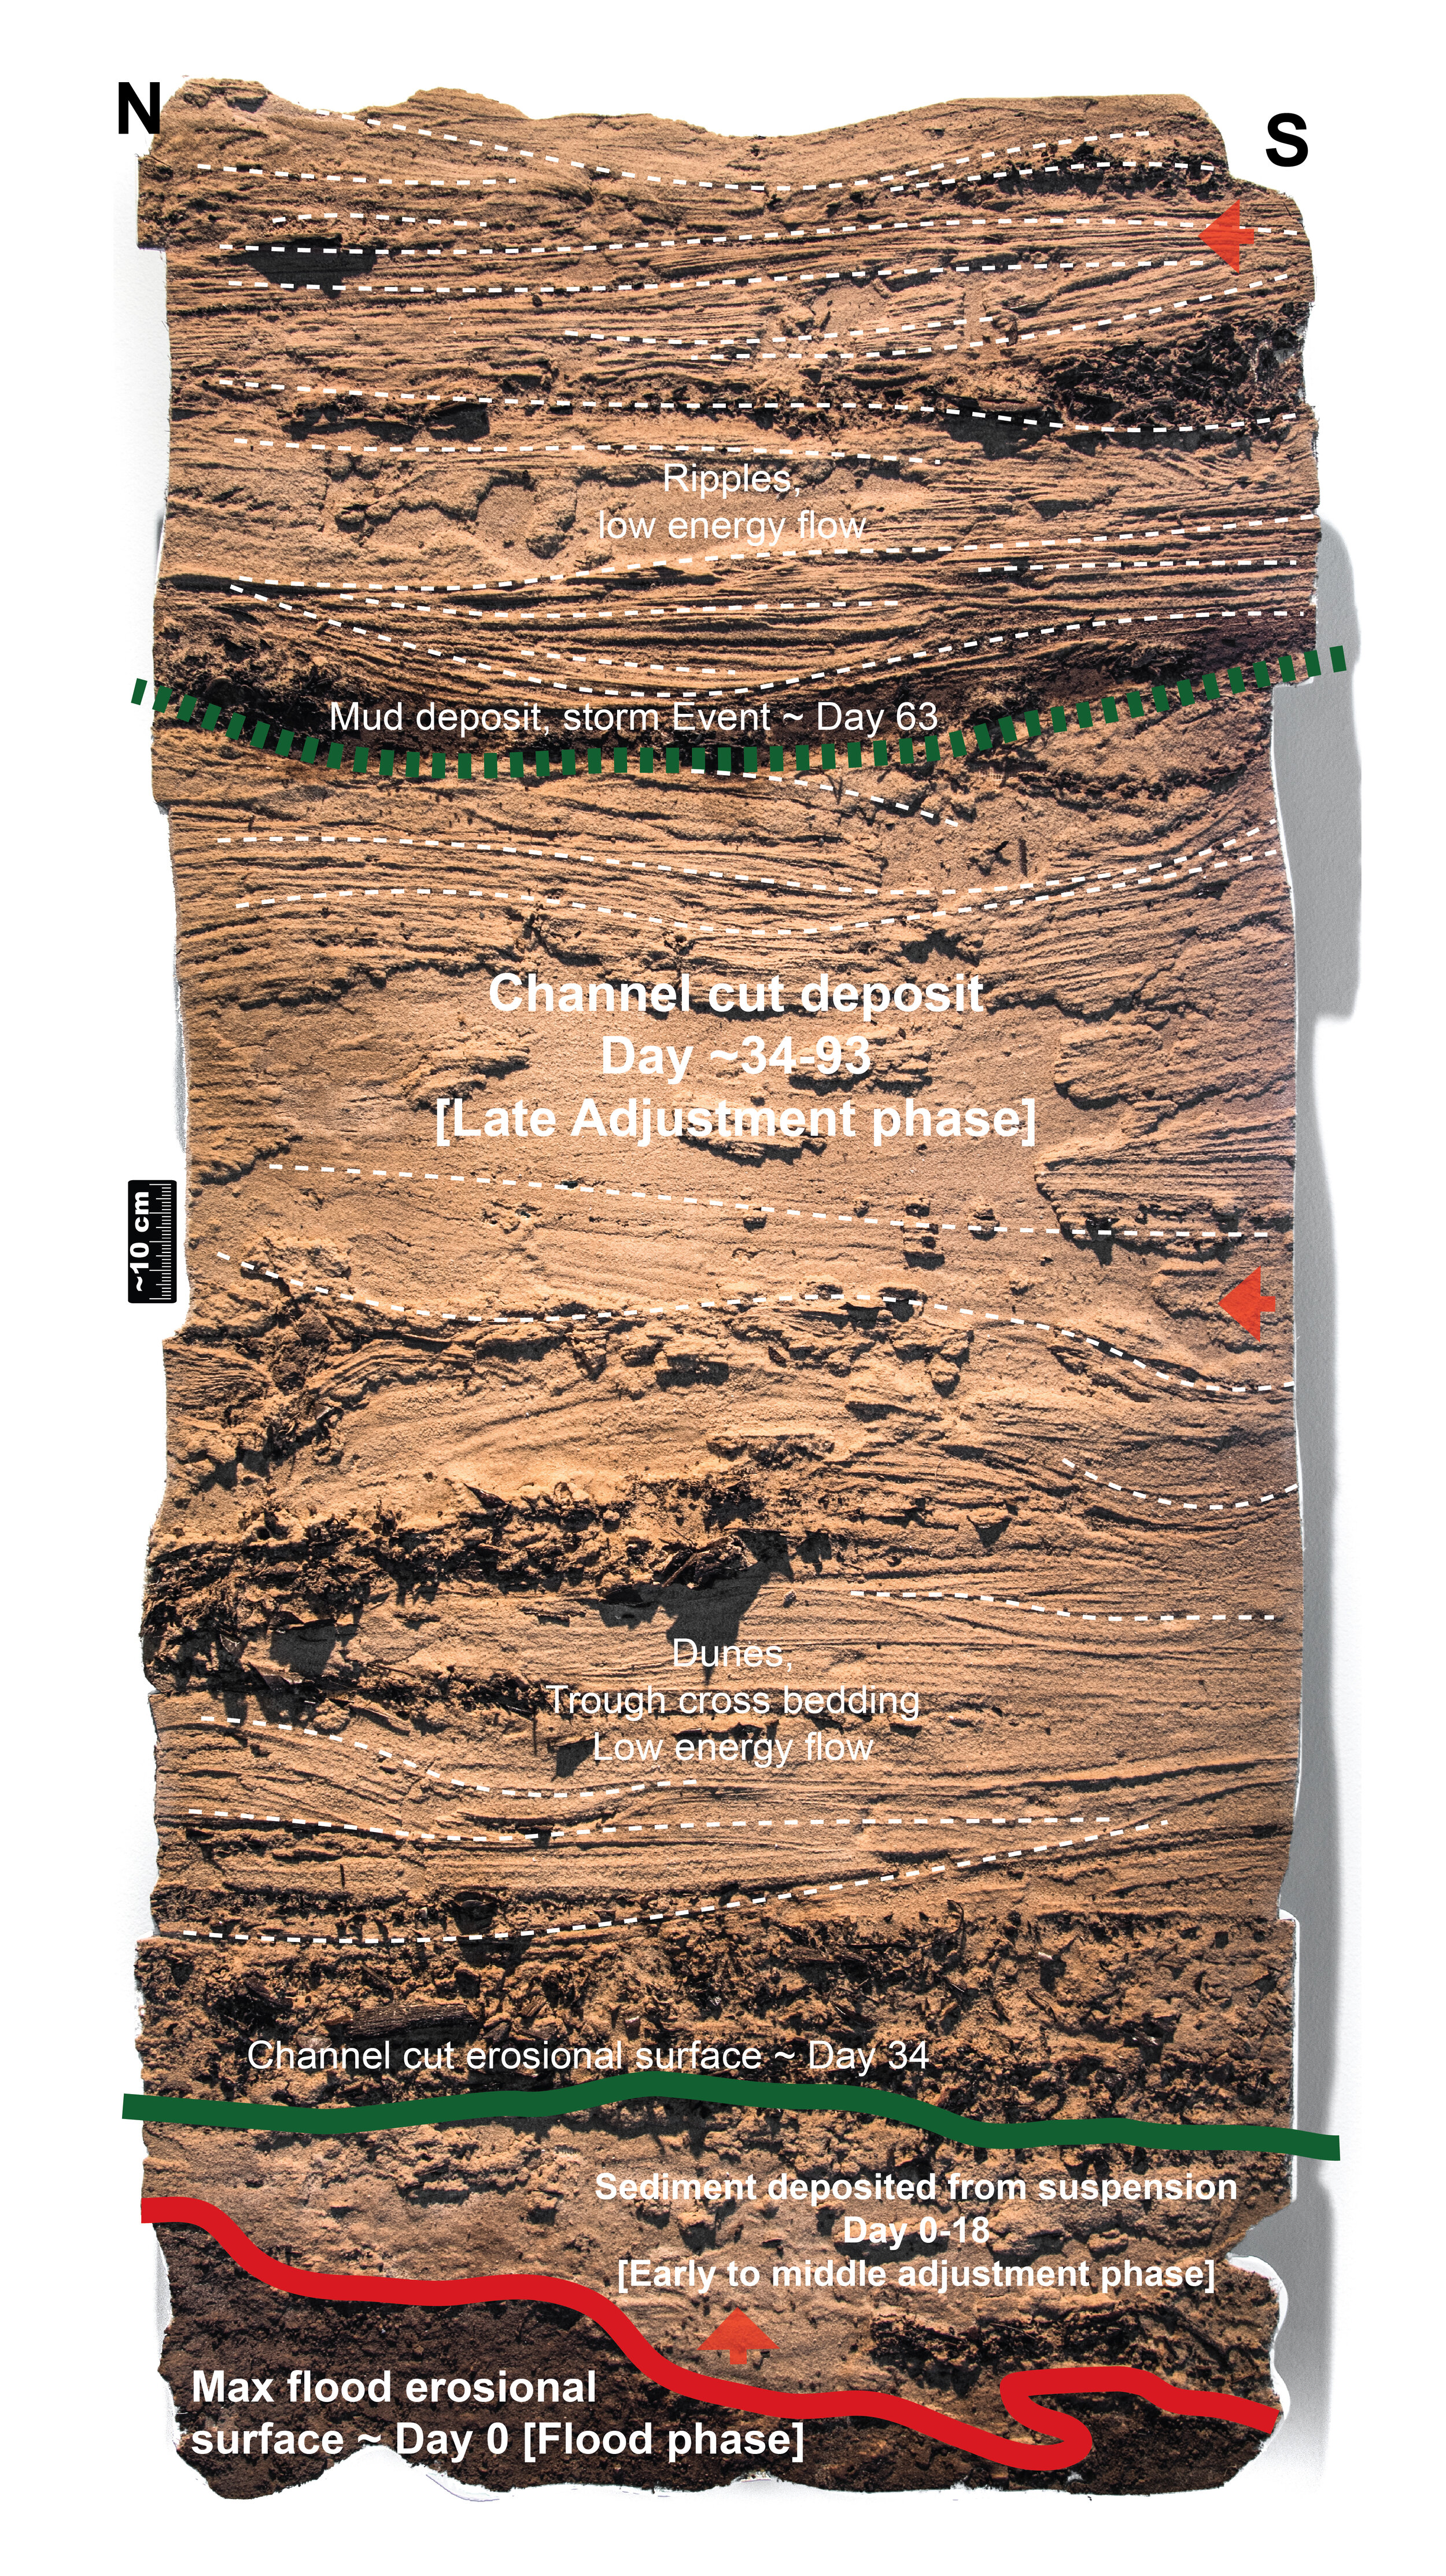
Plate 8B. Sand Peel Sculpture 3 Interpretation
Context, Description, and Interpretation:
Peel 3 records the initial erosion during the maximum flooding phase, rapid deposition of sands as the energy levels quickly dropped, then a late adjustment as flow changed direction 90 degrees as stranded water cut down through the bar and returned to the original channel. A thunderstorm that occurred some months after Hurricane Harvey is recorded by the mud layer near the top of the peel. The hydrologic archive shows the water level’s rapid rise and fall and the return to the channel > 30 days post maximum flooding and again during and after several later thunderstorms. The human impact showed a change from food and shelter needs to financial needs when the bayou returned to the channel, and an increase in medical and PTSD needs during the later thunderstorms.
Summary: Above the pre-Harvey deposit and maximum flood erosional surface, there is sediment deposited from suspension. This is topped by the late adjustment channel cut erosional surface and the large channel cut deposit. Within the channel cut deposit there is a thin mud layer which was deposited by a post-Harvey thunderstorm.
At the base of Peel 3 are pre-Harvey mud deposits overlain by the Harvey erosional surface (red line), which is deeply scoured. Above this lies organic material and sand with no obvious sedimentary structures, indicating that there was so much sediment in the water that it fell out of suspension. This sediment is cut by another erosional surface (solid green line) caused by the change in flow direction and the cross-cutting channel. Above the green line organic material is overlain by trough cross bedding formed by dunes in the upper part of the lower flow regime. Above these dunes, there is a 3 cm thick layer of mud that is rich in organic material (dashed green line), indicating rapid decrease in flow velocity. This mud layer occurred during a post-Harvey thunderstorm event, possibly in early November 2017. Above the mud layer, there are ripples indicating an increase in velocity. Concave foresets above the ripples indicate a high flow velocity and high suspended sediment. The red arrows indicate the easterly flow direction below the solid green line and the northerly flow direction in the cross-cutting channel above the solid green line
Event Timing
Flood phase
August 28, 2017: The red line marks the Hurricane Harvey erosional surface. This erosion occurred during the flood phase as Buffalo Bayou rose to its peak at about 1:00am on August 28, with a measured gauge height of 15 m (41.9 ft). Flow was to the east.
Early to middle adjustment phase
August 28-September 15, 2017: The flow energy in Buffalo Bayou was dropping during this time. A high concentration of sediment in the water caused sediment to be deposited out of suspension. Flow was to the east.
Late adjustment phase
October 1-November 29, 2017: As the water level dropped, stranded water returned to the main channel, eroding across the newly deposited bar at a right angle. These deposits are from the green line to the top of Peel 3. Flow was to the north.
Late adjustment thunder storm
November 1-5?, 2017: There was a smaller scale flood during this time and gauge height reached 1 m (6 ft). This minor flood event was preserved in Peel 3 as a thin mud layer.